

The psychology of the market is the depriving factor that normally scares traders away from the market. Naturally, the market is unpredictable, as a trader you might speculate in a particular direction and the market might swing against your speculations just because the financial institutions are always in charge of the market, through this they have large control over the market.
The question we should ask is, what is the strategy the financial institutions normally use to control the market psychology? They simply use the LIQUIDITY factor, no matter how technical you can be about analysis if you are slack around analyzing without liquidity in perspective then you will be a pig in the market.
The liquidity zone has become a stable traumatic psychology in the mind of every trader. Traders regularly abandon the the market because of the obscurity of the market behavior, they try to speculate but quickly move out because of the fear of liquidity.
Therefore, to progressively achieve good profit from the market, you must pay great attention to two major things,
Never allow market psychology to influence your speculations.
Know that liquidity is deployed to influence your market analysis.
Being a trader what should you do? The major thing you should do is once you see the market pay attention to the liquidity zone at the support and resistance point. Check how the support and resistance zone are been liquidated. In today's technical analysis, I will be doing an expository analysis of liquidity, how you can identify them, and the way out of them.
Liquidity.
Liquidity in the financial institution is the ability to convert assets to cash or gain money through a loan. This is probably the financial institution's definition of liquidity, but in trading liquidity, although it might be similar to conversion, it means a different thing entirely when analyzing the market.
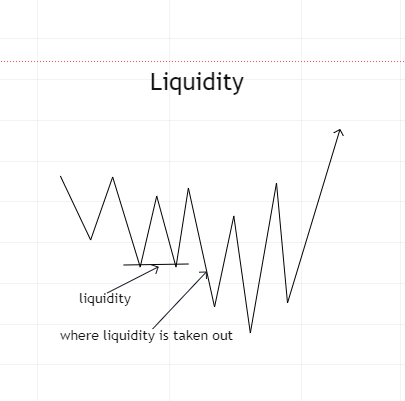
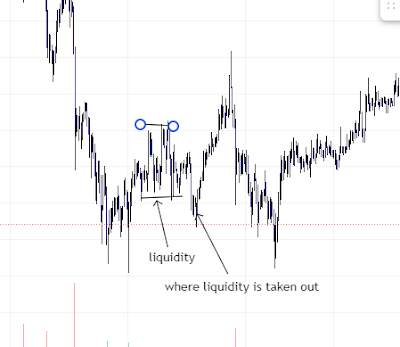
During analysis, liquidity simply means when a mitigated order block is removed. In other words, a certain point of the resistance or support is being mitigated but the financial institution decided to take out the mitigated point because they don't want it to hold.
This is also the trick they use to clear out traders' funds and make them liquidate because they know naturally that when two mitigated order blocks hold, it will be an entering point for traders. This is what traders should be careful of when analyzing the market, pay serious attention to liquidity.
How does this work during analysis?
Chart naturally depicts the psychology of trader in the market, simply the buy and sell which is represented by order blocks, although the position of the order block gives traders an avenue to enter a trade the same order block is used as a snare for liquidity by the financial institution, how do you overcome this? When you see a chart and you look to the support or resistance, pay attention to the mitigated order block, if an order block is mitigated by another order block it does not give an automatic signal to enter the trade, you should hold on for the next order block because the next order block will liquidate the mitigated order block. Once the mitigated order block is being liquidated then it gives us the signal to enter the market.
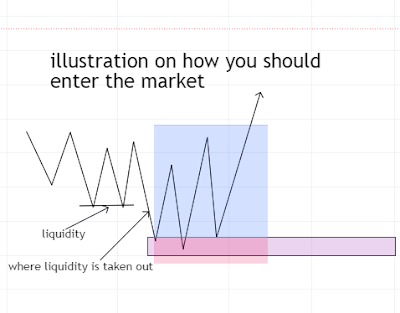
Despite the example stated above with the image illustration, it is important to know that liquidity can appear in various for on a chart, it can appear on a sell side or buy side, this implies that liquidity does not have a single approach in the market it can come in various which every trader must pay attention to.
For you to avoid being a pig in the market, don't allow the psychology of the market to deprive you of paying attention to what matters, you must make a profit and save your funds liquidity must never be neglected when doing technical analysis in the market.


![Trade Like a Pro: How to Find the Best Confirmatory Entering [SMC]](https://blogger.googleusercontent.com/img/b/R29vZ2xl/AVvXsEhi6HcfYopKwRlIavcnGy9duc_aMSBKJ6ZnDFL7STfxrG18qm1eb8ffro_pnXcvsmEpUS1EutpeOhClBbuqOhyqO-q5cMZFQLGqIhHEh-FGVnmkHqlJLm9lzBRG9CWtsul7WyurcCxuSRacnX6En27Ce4tQBdvIpPv0HnOvl_CgPI7l8_Qbnl3Ubv2C2j_2/w72-h72-p-k-no-nu/confirmatory%20entering.PNG)


0 Comments